Dimensional Data Modeling comprises of one or more dimension tables and fact tables. Good examples of dimensions are location, product, time, promotion, organization etc. Dimension tables store records related to that particular dimension and no facts (measures) are stored in these tables.
For example, Product dimension table will store information about products (Product Category, Product Sub Category, Product and Product Features) and location dimension table will store information about location ( country, state, county, city, zip. A fact (measure) table contains measures (sales gross value, total units sold) and dimension columns. These dimension columns are actually foreign keys from the respective dimension tables.
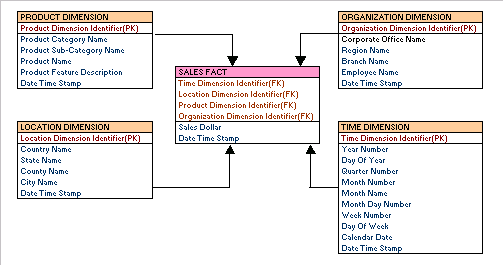
Example of Dimensional Data Model:

In the example figure above, sales fact table is connected to dimensions location, product, time and organization. It shows that data can be sliced across all dimensions and again it is possible for the data to be aggregated across multiple dimensions. “Sales Dollar” in sales fact table can be calculated across all dimensions independently or in a combined manner which is explained below.
- Sales Dollar value for a particular product.
- Sales Dollar value for a product in a location.
- Sales Dollar value for a product in a year within a location.
- Sales Dollar value for a product in a year within a location sold or serviced by an employee
In Dimensional data modeling, hierarchies for the dimensions are stored in the dimensional table itself. For example, the location dimension will have all of its hierarchies from country, state, county to city. There is no need for the individual hierarchical lookup like country lookup, state lookup, county lookup and city lookup to be shown in the model.
Dimensional Data Modeling is used for calculating summarized data. For example,
sales data could be collected on a daily basis and then be aggregated to the week level, the week data could be aggregated to the month level, and so on. The data can then be referred to as aggregate data. Aggregation is synonymous with summarization, and aggregate data is synonymous with summary data. The performance of dimensional data modeling can be significantly increased when materialized views are used. Materialized view is a pre-computed table comprising aggregated or joined data from fact and possibly dimension tables which also known as a summary or aggregate table.
Online Dimensional Data Modeling Training | Data Warehouse Training | Data Mart Training
Course Description:
The dimensional data modeling training explains how to design Data Ware House and Data Marts from OLTP data models.
What you can learn in our Dimensional Data Modeling training?
- Why do you need a data warehouse?
- What is the reason for a data mart?
- Why is star schema? How is that different from dimensional data modeling?
- Why customers prefer dimensional data modeling or snow flake modeling?
- What are slowly changing dimensions?
To get more information about this training program, send an email to Training@LearnDataModeling.Com 0r call us @ 91-9080157239.
